A variable is any characteristics, number, or quantity that can be measured or counted. A variable may also be called a data item.
It is called a variable because the value may vary between data units in a population, and may change in value over time. For example; ‘income’ is a variable that can vary between data units in a population and can also vary over time for each data unit.
Examples of variables: Age, sex, business income and expenses, country of birth, capital expenditure, class grades, and eye colour, etc.
Types of Variables:
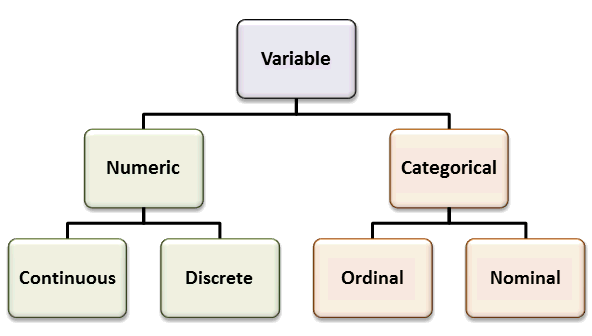
Numeric variables:
These variable have values that describe a measurable quantity as a number, like ‘how many’ or ‘how much’. Therefore numeric variables are quantitative variables. The data collected for a numeric variable are quantitative data. They may be further described as either continuous or discrete
Continuous Variable:
A continuous variable is a numeric variable which can take any value between a certain set of real numbers. The value given to an observation for a continuous variable can include values as small as the instrument of measurement allows. Their values are obtained by measuring. They are represented by connected points on graph. They can assumes infinite number of different values in the range.
Examples of continuous variables include height, time, age, and temperature.
Descrete Varaiable:
A discrete variable is a numeric variable which can take a value based on a count from a set of distinct whole values. They can assume a finite number of isolated values.
A discrete variable cannot take the value of a fraction between one value and the next closest value. Values are obtained by counting. They are represented by isolated points on the graph. They can whole number values in given range.
Examples: the number of registered cars, the number of children in a family, etc.
Catelogical Variable:
Categorical or qualitative variables can take values that describe a ‘quality’ or ‘characteristic’ of a data unit, like ‘what type’ or ‘which category’. Categorical variables fall into mutually exclusive (in one category or in another) and exhaustive (include all possible options) categories. They tend to be represented by a non-numeric value. The data collected for a categorical variable are qualitative data. They may be further described as either ordinal or nominal:
Ordinal Variable:
An ordinal variable is a categorical variable which can take a value that can be logically ordered or ranked. There is a clear ordering of the variables. The categories associated with ordinal variables can be ranked higher or lower than another, but do not necessarily establish a numeric difference between each category.
Examples of ordinal categorical variables include academic grades (i.e. A, B, C), clothing size (i.e. small, medium, large, extra large) and attitudes (i.e. strongly agree, agree, disagree, strongly disagree). If these categories were equally spaced, then the variable would be an interval variable.
Nominal Variable:
A nominal variable is a categorical variable which can take a value that is not able to be organised in a logical sequence.
Examples: sex, business type, eye colour, religion and brand.
Types of Measurement Scales from Type of variables:
Data can be classified as being on one of four scales: nominal, ordinal, interval or ratio. Each level of measurement has some important properties that are useful to know. For example, only the ratio scale has meaningful zeros.
Nominal:
The nominal scale places non-numerical data into categories or classifications. They are assigned a category. They don’t have a numeric value and so cannot be added, subtracted, divided or multiplied. They also have no order.
Examples: Placing individuals on the basis of sex, business type, eye colour, religion and brand.
Ordinal:
The ordinal scale contains things that you can place in order. Ordinal scales are made up of ordinal data. For example, hottest to coldest, lightest to heaviest, richest to poorest, etc. Thus in ordinal scale the data is ranked.
The ordinal scale and interval scales are very similar to each other and are often confused. If you assume that the differences between the variables are equal the scale is an interval scale.
A major disadvantage with using the ordinal scale over other scales is that the distance between measurements is not always equal. If you have a list of numbers like 1, 2 and 3, you know that the distance between the numbers, in this case, is exactly 1. But if you had “very satisfied”, “satisfied” and “neutral”, there’s nothing to say if the difference between the three ordinal variables is equal.
Interval:
An interval scale has ordered numbers with meaningful divisions. It is a quantitative data with an ordered scale in which the interval between data values is meaningful. Zero is not meaningful in interval scale.
For example, the difference between a 100 OC and 90 OC is the same difference as between 70 OC and 80 OC.
Ratio:
The ratio scale is exactly the same as the interval scale with one major difference: zero is meaningful. For example, a temperature of 0 OC is meaningful. The zero in a ratio scale means that something doesn’t exist.
Example: Weight in kilograms is a very good example since it has a definite ratio from one weight to another. 50kg is indeed twice as heavy as 25 kg.
Note: If the clock starts ticking when you are born, but an age of “0” technically means you don’t exist. If the weighing scale shows 0 kg, therefore you don’t exist. If the height is 0 then have no height and hence do not exist.
3 replies on “Variables in Statistics”
Allah bless you ☺️🙏
Great job 👍👌
It is a very nice article 😊 it is very effective ☺️ for me love this ..thanku 😊
it has really helped me thank you
A nice article👌