Science > Biology > Human Population and Population Control > Attributes of Human Population Part – I
Group of individuals of the same species occupying a particular geographic area at a given time and have the capability to breed with each other. The population is a taxonomic category lower than the species. Population share a common gene pool which changes with the adaptation with the environment. Hence the population is a unit of evolution. The population has an important role in the biotic community of the ecosystem. In this article, we shall discuss the human population.
Attributes of Human Population:
According to Thomas Park, a human population exhibits several attributes.
Population Size:
It is the total number of individuals of a species in a given area at a given time. It is denoted by the letter ‘N’. Population size influences the chances of a species surviving or going extinct. Generally, very small populations are at greatest risk of extinction. For e.g. in 2011 the world population was 7 billion.
Population Density:
It is the number of individuals or biomass of a species per unit area or volume at a given time. The area is used for land organisms and volume is used for aquatic animals. The population density of India in 2011 was 382 per sq km.
There are two types of population density: The crude density and ecological density. The crude density is the total number of individual biomass per unit area or total volume. The ecological density is the number of total area or volume which is actually inhabited by these individuals.
Study of population density indicates the successful nature of the population and helps us to understand future birth date or future death rate. It helps in planning for the future. The increased population density decreases population growth rate due to the shortage of living space, food, and natural resources
Population Distribution:
Population density just gives the average number of individuals per unit of area or volume while population distribution describes how the individuals are distributed or spread throughout their habitat. Often, individuals in a population are not spread out evenly. Instead, they may live in clumps or some other pattern. The pattern may reflect characteristics of the species or its environment.
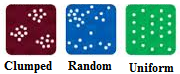
Clumped: individuals clump into groups or clusters. It is often in response to the uneven distribution of resources. It is the most common pattern in nature.
Random: In this distribution, individually spaced in a pattern-less, unpredictable way. The population doesn’t interact strongly with one another. It is due to non-uniform aspects of their environment. It is not common in nature
Uniform: In this distribution, individuals are uniformly or evenly spaced. It often results from interactions between individuals. It is relatively common in nature.
Age Structure and Age Distribution:
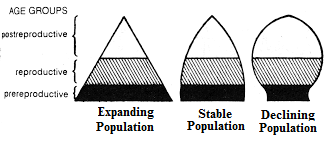
It represents the percentage of individuals of different age groups such as young, adults and old. According to Bodenheimer (1958), the individuals of a population can be divided into pre-reproductive (young) , reproductive (adult) and post-reproductive (old) groups. With regard to age distribution the population can be classified as:
Rapidly growing or expanding population:
This population has a high proportion of infants and children (0 – 14 years of age group). It is called the young population. Here the birth rate is high and the death rate is low. Indian population has 42% young population.
Stable population:
this population consists of adults of reproductive age. In this group the birth and death rate are equal.
Declining or diminishing population:
This population has more old people with low birth rate and high death rate.
Age Pyramid:
It represents the age distribution in a population, in which number of individuals in different age groups is shown by the relative width of successive horizontal bars.
There are three types of age pyramids:
Pyramid with a broad base:
It shows a rapidly growing population. The birth rate is very high. The death rate is very low. The pyramid also signifies an exponential growth in the population. In such cases, each successive generation will have less number of old persons than the preceding one.
Bell shaped Pyramid:
The size of the productive group and the non-productive group is almost equal. The size of the post-reproductive group is small.
Urn shaped pyramid:
If birth rate is abnormally low, then the sizes of post reproductive group and the reproductive group increases in proportion with the size of pre reproductive group.
Sex Ratio:
This ratio denotes the number of males and females per thousand individuals. In an ideal bisexual population, the number of males and the number of females should be equal. But in the human species, the ratio between males and females at birth is slightly biased towards the male sex. The natural “sex ratio at birth” is often considered to be around 105. This means that at birth on average, there are 105o males for every 1000 females. Nature provides that the number of newborn males slightly outnumber newborn females because as they grow up, men are at a higher risk of dying than women not only due to sex differentials in natural death rates but also due to higher risk from external causes (accidents, injuries, violence, war casualties). Thus, the sex ratio of the total population is expected to equalize. The number of females in active reproductive age influences the birth rate or natality of the population.
In India by 2011 census there are 933 females for every 1000 males. If a country’s population sex ratio does not equalize or rather exceeds the 105-threshold, it means societies with a dominating preference for male child tend to intervene in nature and reduce the number of born girl child by sex-selective abortion and infanticide.
Age-sex structure of a population can be represented by a graph in the form of a pyramid by plotting the percentage of the population of each sex in each age group.

We will discuss more attributes of human population in the next article.
Migration of Population:
- Migration: It is the movement of individuals into and or out of a given area.
- Emigration: It is the permanent movement of some persons from the existing population of a country, state or city to a different country, state or city.
- Immigration: It is the permanent entry of persons from outside the country or state into the existing population of a country.
Both immigration and emigration change the population size. Only net immigration increases the population of a country.
Next Topic: Attributes of Human Population Part – II