Science > Physics > Motion in a Straight Line > Displacement – Time Graphs (s-t Diagram)
The motion of a body can be analyzed effectively by plotting different types of graphs. viz: Displacement-Time graph, Velocity-time graph, etc. In this article, we shall study Displacement-Time graphs and their interpretation.
Displacement – Time Graphs For Body at Rest:
Displacement – time graph shows the change in displacement of a body from a fixed point or the position with time. To draw an s–t graph, time is plotted along the x-axis, and displacement is plotted along the y – axis.
Displacement – Time Graph for a Stationary Body:
If the body is stationary or at rest, its position from a fixed point does not change with time.
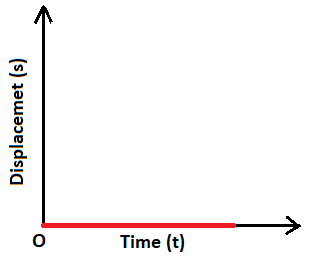
a) The body has no initial displacement at t = 0:
Example: A bus stopped at a bus stop (reference point is the bus stop). In this case, the graph starts from the origin and continues along the x-axis
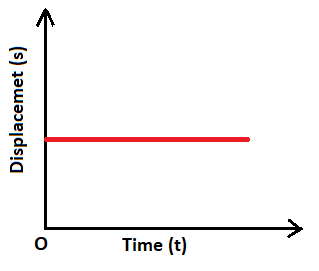
b) The body has an initial displacement at t = 0:
Example: A bus stopped at a point 5 m ahead of a bus stop (reference point is the bus stop). In this case, the displacement of the bus will remain 5 m for all instants of time. Thus s – t graph for a stationary body will start from s = 5m and is parallel to the x-axis
Displacement – Time Graphs For Uniform Motion
If a body travels equal distances in equal intervals of time, then the motion of the body is said to be a uniform motion. Thus, this graph is a straight line inclined to the x-axis.
Body is Moving in the Same Direction to Displacement with Uniform Velocity:
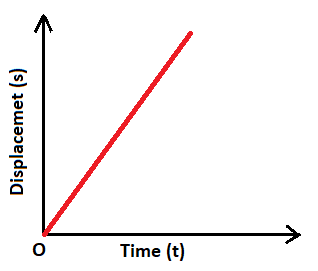
a) Body has no initial displacement at t = 0:
Example: A bus crossing a bus stop with uniform velocity 50 km h-1 (reference point is the bus stop). In this case, the graph starts from the origin and is inclined to the x-axis.
b) Body has an initial displacement at t = 0
Example: A bus crossing a point 5 m ahead of a bus stop with uniform velocity 50 km h-1 (reference point is the bus stop). In this case, the graph starts from s = 5 m and is inclined to the x-axis.

Body is Moving in Opposite Direction to Displacement with Uniform Velocity:
Here graph makes an obtuse angle with the positive direction of x-axis. Displacement decreases with time. The body is moving in opposite direction to its displacement. Example: The motion of a bus in its return journey.
Displacement – Time Graphs For Non Uniform Motion
Distance – Time graph for uniform acceleration:
For such type of motion, the graph is a curved line and is parabolic in nature. It is observed that the steepness of the graph increases and therefore the slope as well as the speed (magnitude of velocity) increases. The slope of tangent at a point on the curve gives velocity of the body at that instant.
a) Body has no initial displacement at t = 0:
Example: Train departing from a railway station. (Reference point is the railway station)
b) Body has initial displacement at t = 0:
Example: Train which is at rest departing from a signal 5 km away from a railway station. (Reference point is the railway station)
Distance – Time graph for uniform retardation:
In this case also the graph is parabolic and curved but in opposite sense. In this case the steepness gradually decreases indicating uniform retardation. The slope of tangent at a point on the curve gives velocity of the body at that instant.
a) Body has no initial displacement at t = 0
b) Body has initial displacement at t = 0
Body is Moving in Opposite Direction to Displacement with Uniform Acceleration:
Body is Moving in Opposite Direction to Displacement with Uniform Retardation:
Importance of Displacement Time Graphs:
- It helps to find position of a body at any instant during its journey.
- Slope of tangent at point to the curve obtained gives instantaneous velocity of the body at that point.
- Average velocity of the body can be obtained by finding the slope of the line joining the initial and final position of the body.
- From the graph the nature and type of the motion of the body can be determined.
Concept Application
Q1. Draw a displaceent time graph for the following data with respect to a motion of particle. Interpret the type of motion.
| Time (t) in s | 0 | 1 | 2 | 3 | 4 |
| Displacement (s) in m | 0 | 5 | 20 | 45 | 80 |
The graph is as follows:
The nature of the graph (a curve) shows that the body is moving with non-uniform velocity and has uniform acceleration.
Q2. Draw a displaceent time graph for the following data with respect to a motion of particle. Interpret the type of motion.
| Time (t) in s | 0 | 1 | 2 | 3 | 4 | 5 |
| Displacement (s) in m | 0 | 10 | 20 | 30 | 40 | 50 |
The graph is as follows:
The nature of the graph (straight line) shows that the body is moving with uniform velocity.
Q3. Draw a displaceent time graph for the following data with respect to a motion of particle. Interpret the type of motion.
| Time (t) in s | 0 | 1 | 2 | 3 | 4 |
| Displacement (s) in m | 0 | 45 | 80 | 105 | 120 |
The graph is as follows:
The nature of the graph (a curve) shows that the body is moving with non-uniform velocity and has uniform retardation.