Science > Physics > Refraction of Light > Emission and Absorption Spectra
A spectrum is a pattern which gives the wavelengths of radiation emitted (or absorbed) by a substance. The spectra in the visible region are divided into two groups. Emission spectra and absorption spectra. We use a spectrometer to study a spectrum. Light from the source is made incident on the slit of the spectrometer. The collimator of the spectrometer is adjusted to obtain a parallel beam of light. This parallel beam of light passes through the prism. The prism produces a dispersion of light and the spectrum i.e., the pattern of wavelengths present in the incident light can be seen through the telescope.
Emission Spectra:
They are produced due to the light energy emitted by different substances when they are heated to very high temperatures. When the light emitted by a source is dispersed into its constituent wavelengths (colours), by passing it through a prism, we get an emission spectrum.
From the appearance of the spectrum, we classify the emission spectra into three groups (i) Line spectra (ii) Band spectra (iii) Continuous spectra
Line spectra (Atomic spectrum):
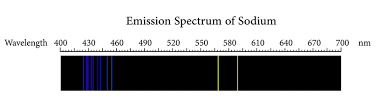
A line spectrum consists of a number of sharp lines of different colours (wavelengths), situated at different places in the spectrum, on a dark background. Following sources of a line spectra are used in the laboratory. Sodium vapour lamp, mercury vapour lamp, discharge tubes containing hydrogen, neon, helium gas etc.
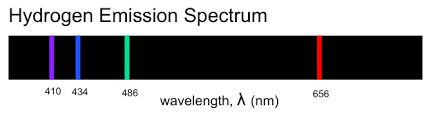
Sodium gives two yellow lines of wavelengths 5890 Å and 5896 Å. Hydrogen spectrum consists of four lines, in the visible region.
A line spectrum is produced due to the radiations emitted by the atoms in the gaseous state. Hence they are also known as atomic spectra. They give valuable information about the structure of the atom.
The number of lines and their wavelengths depends upon the element. The line spectrum of a given element cannot be ‘copied’ by any other element. Hence a line spectrum is considered as the signature o the element. If we know the spectra of different elements, it is possible to identify various elements present in a mixture.
Brand spectrum (Molecular spectrum):
Electromagnetic radiation emitted by the molecules in the gaseous state form a band spectrum. Hence it is also known as molecular spectrum. It consists of a large number of bands or strips of coloured light with dark gaps between them.
Each band is bright at one edge called the band head. The intensity of the band decreases gradually towards the other end, called the tail of the band. When a band is observed with an instrument of high resolving power, we find it consists of a large number of closely packed lines near the band head.

A band spectrum gives information about the molecular structure. If we study band spectra of different gases e.g. O2, N2, CO2 etc, we find that the spectra are not identical. Therefore by recording the band spectrum of the mixture. it is possible to find the molecules of different kinds present in a mixture of gases. Band spectrum can be considered as a fingerprint of the substance.
Band spectra are obtained from moderately heated liquids and gases, because at high temperatures. Molecules break up into atoms.
Continuous Spectrum:
When we examine the radiation from an incandescent solid (a solid heated to a very high temperature), carbon arc., candle filament of an electric lamp etc. we find that all the wavelengths are present in the spectrum, i.e. the spectrum is a continuous luminous band containing all colours ranging from violet to red without any gap.

The intensity of light in different parts of the spectrum is different and it depends upon the nature and temperature of the source.
Radiation emitted by all solids, liquids and gases at high temperature forms a continuous spectrum and its appearance is the same in all the cases.
Absorption Spectra:
Emission spectra are produced when the light energy is absorbed by a material medium placed in the path of the light. The absorption spectrum is obtained as follows:
The light from a source of white light (carbon arc) is made incident on the slit of a spectrometer and a continuous emission spectrum is obtained by proper adjustment of collimator, prism and the telescope.
Then the substance whose absorption spectrum is to be observed, is introduced between the source and the spectrometer. And the new spectrum is observed. Dark line or bands are observed in the continuous emission spectrum. These dark lines or bands represents the absorption spectrum of that substance.
- Example: If a blue cobalt glass is used as an absorbing substance, three dark bands are observed. Similarly, a solution of potassium permanganate gives five dark bands in the green region of continuous spectrum.
- Atoms in the gaseous state show line absorption substance, three dark bands are observed. Similarly, a solution of potassium permanganate gives five dark bands in the green region of continuous spectrum.
- Atoms in the gaseous state show line absorption spectra. An opaque substance gives rise to a continuous absorption spectrum.
Reversal of Spectral lines:
When the slit of a spectrometer is illuminated with light from carbon arc lamp, a continuous spectrum is observed. Now if a sodium flame is interposed between the arc and the slit, two dark lines appear in the yellow region on the continuous spectrum exactly at the same position where the two sodium lines of wavelength 5890 and 5896 A. U. were observed.
However, if an opaque screen is inserted between the arc and the sodium flame, the yellow lines once again reappear. This means that sodium vapour which normally emits the two yellow lines when its temperature is higher than the surroundings, now absorbs the same wavelengths when its temperature becomes less than that of the surroundings.
Thus in the absence of carbon arc the temperature of sodium flame is higher than that of the surroundings and it emits two yellow lines. But in the presence of strong arc lamp the temperature of sodium flames becomes less than that of the surroundings (i.e. arc lamp) and it starts absorbing the very same lines (wavelengths) which it was emitting.
Kirchoff’s law is applicable to the emission and absorption of light by any substance.
Fraunhofer Lines:
If we carefully examine, the continuous spectrum produced by the Sun, it is found to contain a number of dark lines spread over the entire length of the spectrum. These lines are discovered by Wouaston in 1802. Later Fraunhofer mapped these lines and measured their wavelengths. He concluded that these lines occur in certain definite places in the solar spectrum and have definite wavelengths.
On account of their definite wavelengths he suggested that these lines can be used as standard wavelengths. The prominent lines in the visible spectrum were named by him as A, B, C, D……However, he could not explain why these lines occur at all. The lines could not be explained until Bunsen and Kirchoff in 1850 gave a satisfactory explanation based on the theory of absorption.
Explanation :
- The central core of the Sun, called the photosphere is very hot. Its temperature is about 20 million degrees Kelvin and it is assumed to emit white light. The photosphere is surrounded by coloured gaseous envelope. Which is called chromospheres or reversing layer. This layer is also called the Sun’s atmosphere. It contains elements like Fe, Ni, Ca etc. in gaseous form.
- When white light from the photosphere passes through the relatively cooler chromosphere all the elements presents in it absorb their characteristic wavelength (like sodium absorbing yellow lines) and produce dark lines in the continuous solar spectrum.
- Thus Fraunhofer lines in continuous solar spectrum are formed on the same principle as that of reversal of spectral lines. By studying these lines we can study the composition of the atmosphere of sun.