
Problem of Choice
- In any choice problem, there is a feasible set of alternatives. The alternatives which are available to the individual constitute this feasible set.
- The individual is assumed to be clear in her mind about her likes and dislikes (preferences) and has the capacity to compare any two alternatives (rational) in the feasible set using this capacity it can prepare the order of preferences starting from the best. The feasible set and the preference relation defined over the set of alternatives together constitute the basis of choice.
Demand:
- In economics the meaning of desire is different from desire, want, need, will or wish. In economics, the word demand has three constituent.
Demand = Desire to buy + Ability to pay + Willingness to play
If any of this condition is not satisfied, it is not a demand.
- Demand is an economic concept that describes a consumer’s desire, ability, and willingness to pay a price for a specific good or service. The demand depends on the prices of the goods, the consumer’s income, and his/her preferences.
Characteristics of Demand:
- It is backed by adequate purchasing power.
- It is always at some price.
- It is related to time
- It is always expressed in a specific quantity.
Demand Schedules:
- The demand schedule shows exactly how many units of a good or service will be bought at each price. They are further classified as
Individual Demand Schedule:
- It is a list of various amounts of a commodity that an individual consumer is willing to buy (and seller to sell) at different prices at a particular period of time.
| Month in 2014 | Price/kg (In Rupees). | Quantity (in kg) |
| Jan | 50.00 | 2 |
| Feb | 40.00 | 3 |
| Mar | 30.00 | 4 |
| Apr | 20.00 | 5 |
| May | 10.00 | 6 |
- From the demand schedule, we can observe that the demand is inversely proportional to price. i.e. as the price decreases then the demand increases and when price increases the demand decreases.
Market Demand Schedule:
- When the demand schedules of all buyers are taken together, we get the aggregate or market demand schedule.
| Month in 2014 | Price/kg (In Rupees). |
Quantity (in kg) | |||
| Consumer A | Consumer B | Consumer C | Total Market Demand | ||
| Jan | 50.00 | 2 | 1 | 3 | 6 |
| Feb | 40.00 | 3 | 2 | 4 | 9 |
| Mar | 30.00 | 4 | 3 | 5 | 12 |
| Apr | 20.00 | 5 | 4 | 6 | 15 |
| May | 10.00 | 6 | 5 | 7 | 18 |
What is a Function?:
- Consider any two variables x and y. A function y = f (x) is a relation between the two variables x and y such that for each value of x,
there is a unique value of the variable y. Thus f (x) is a rule which assigns a unique value y for each value of x. - The value of y depends on the value of x, hence y is called the dependent variable and x is called the independent variable.
- A function y = f (x) is an increasing function if the value of y does not decrease with an increase in the value of x. It is a decreasing function if the value of y does not increase with the increase in the value of x.
- The relation between y and x can be shown graphically. Usually, in a graph, the independent variable is plotted along the horizontal axis (x-axis) and the dependent variable is measured along the vertical axis (y-axis). However, in economics, often the opposite is done. For example, to plot the demand curve, the independent variable (price) is taken along the vertical axis (y-axis) and the dependent variable (quantity) along the horizontal axis (x-axis).
- The graph of an increasing function is upward sloping or and the graph of a decreasing function is downward sloping.
Demand Function:
- The demand for a product or service is affected by the income of an individual, availability of other substitutes, the price of other substitutes, population, habit etc. Thus demand is a function of demand of commodity, price of commodity, price of the compliment, income of the consumer, tastes and preferences of consumers, impact of advertisement, price of the substitute, expected future price, expected income in future, wealth of consumer and other factors which may impact the demand (for e.g. weather conditions, inflation, deflation, standard of living, composition of population, culture, customs, fashions, styles, etc.).
- If the prices of other goods, the consumer’s income and his/her tastes and preferences remain unchanged, the amount of a good that the consumer optimally buys, becomes entirely dependent on its price. The relation between the consumer’s optimal choice of the quantity of a good and its price is very important and this the relation is called the demand function.
q = f(p)
Where q is demand (quantity) whose value depends on p the price.
q is the dependent variable while p is the independent variable.
Demand Curve:
- The demand curve is a graphical representation of how many units of a good or service will be bought at each possible price. It plots the relationship between quantity and price that’s been calculated on the demand schedule.
- The graphical representation of the demand function is called the demand curve.
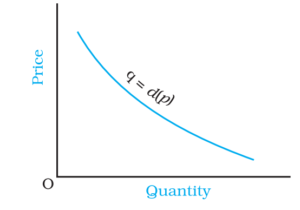
- The negative slope of the demand curve shows that the quantity demanded goes on increasing with the increase as price falls and vice versa.