
Science > Biology > Human Population and Population Control > Attributes of Human Population Part – II
Population growth is the increase in the number of individuals in a population. The growth rate is the number of individuals added per thousand individuals in a given time. The growth rate can be represented by a graph called a growth curve. In this graph, the total numbers of individuals in a population is plotted against time.
Different Types of Population Curves:
S-Shaped or Sigmoid Curve:
The graph shows the s-shaped growth pattern of the population which has stabilized in an area. This type of curve is shown by a culture of Yeast cells. The curve has 5 phases.

- Lag Phase: When a few organisms are introduced in an area, the population increase is very slow in the beginning and there is very little increase in the population size. Initially, population growth is slow because there are few reproductive individuals that are likely widely dispersed.
- Positive Acceleration Phase: It is positive acceleration phase. During this phase, the growth in population size is observed.
- Exponential or Logarithmic Phase: In the middle of the curve, the population increase becomes very rapid, i.e., logarithmic phase. It is the period of the rapid growth of population due to favourable conditions and no competition.
- Negative Acceleration Phase: In this phase, the rate of population size increase is slowed down, until an equilibrium is attained.
- Stationary Phase: During this phase, the growth rate stabilizes due to mortality and natality rate becomes equal. The population size fluctuates around the equilibrium according to the variability of the environment. The level beyond which no major increase can occur is referred to as saturation level or carrying capacity (K).
In general there are three phases, Lag phase, exponential phase and stationary phase.
J – Shaped Curve:
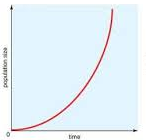
- Lag Phase: Initially, population growth is slow because there are few reproductive individuals that are likely widely dispersed and the individuals of population adapt to a new environment.
- Exponential or Logarithmic Phase: In the middle of the curve, the population increase becomes very rapid, i.e., logarithmic phase. It is the period of the rapid growth of population due to favourable conditions and no competition. Enough food and space are available.
- Decline Phase or Population Crash: After attaining the peak value, the population may abruptly crash. After some time, due to increase in population size, food supply and the space in the habitat becomes limited which ultimately results in a decrease in population size. For example, many insect populations show an explosive increase in numbers during the rainy season, followed by their disappearance at the end of the season.
Difference in J shaped Curve and S-Shaped Curve:
| S-shaped curve | J-shaped curve |
| Mainly it comprises the lag phase, exponential phase and stationary phase. | It comprises only two phases – lag phase and exponential phase. |
| Population becomes stable with zero growth rate and the curve becomes stationary (horizontal). | Population faces mass mortality in the end, and the curve stops. |
| It is observed by most species including humans. | It is observed in few organisms such as algal blooms, annual plants, insects, reindeer and annual plants. |
Birth Rate or Natality:
Natality in population ecology is the scientific term for birth rate. Along with mortality rate, natality rate is used to calculate the dynamics of a population. They are the key factors in determining whether a population is increasing, decreasing or staying the same in size.
The birth rate of a population is defined as the average number of new individuals produced by the population in a unit of time (i.e. one year). The maximum birth rate of a species can achieve under ideal environmental conditions is called potential natality or maximum birth rate or total fertility rate (TFR). It depends on the sexually mature male and female in the population and also on the number of eggs produced per female in unit time.
With respect to the human population, the birth rate is expressed as the number of births per year per thousand persons in the population. Birth rate does not show the population growth rate and current fertility pattern.
Fertility Rate:
Total fertility rate (TFR) is the total number of children born or likely to be born to a woman in her life time if she were subject to the prevailing rate of age-specific fertility in the population. TFR of about 2.1 children per woman is called Replacement-level fertility (UN, Population Division). This value represents the average number of children a woman would need to have to reproduce herself by bearing a daughter who survives to childbearing age. If replacement level fertility is sustained over a sufficiently long period, each generation will exactly replace itself without any need for the country to balance the population by international migration.
The replacement level (RL) is the number of children a couple must produce to replace themselves. In developing countries it is 2.7 while in developed countries it is 2.1. The fertility rate is controlled by economic level, education, and human aspirations.
Death rate or Mortality:
Mortality rate, or death rate, is a measure of the number of deaths (in general, or due to a specific cause) in a particular population, scaled to the size of that population, per unit of time. Mortality is of two types: Potential mortality and actual mortality:
- Potential mortality: It is also called minimum mortality. It is the number of deaths which occur under ideal conditions of malnutrition or old age.
- Actual mortality: It is also called realized mortality. It is the number of deaths which occur in the population. This rate depends upon the size, composition, and density of population.
When the birth rate and death rate are equal, the condition is called the demographic transition. When a country becomes developed a demographic transition takes place.
Vital index of population is percentage ratio of natality over mortality.
Vital index = (Natality/Mortality) x 100
Previous Topic: Attributes of Human Population Part – I
Next Topic: Attributes of Human Population Part – III