Science > Mathematics > Statistics and Probability > Probability > Normal Distribution 01
The normal distribution refers to a family of continuous probability distributions described by the normal equation.
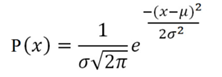
on the domain x ∈ (- ∞, ∞)
where x is a normal random variable, μ is the mean, σ is the standard deviation,
Thus the normal distribution can be completely specified by two parameter mean (μ) and standard deviation (σ) and is represented as N(μ, σ).
Mathematicians called this distribution a normal distribution, a physicist called it a Gaussian distribution, and scientists called it a bell curve due to its bell-like shape.
The normal distribution with mean μ = 0 and standard deviation, σ = 1 is called the standard normal distribution. It is denoted by N(0, 1).
Characteristics of a Normal Distribution
- The normal curve is symmetrical about the mean μ. It is perfectly symmetrical around its center. That is, the right side of the center is a mirror image of the left side.
- The mean is at the middle and divides the area into halves. The center of a normal distribution is located at its peak, and 50% of the data lies above the mean, while 50% lies below. It means that the mean, median, and mode are all equal in a normal distribution.
- There is also only one mode, or peak, in a normal distribution.
- Normal distributions are continuous and have tails that are asymptotic.
- The total area under the curve is equal to 1;
- It is completely determined by its mean and standard deviation (SD) σ (or variance σ2)
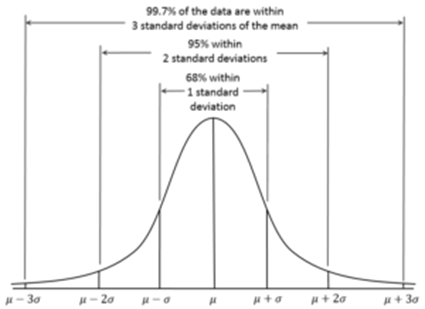
- Approximately 68 % of the data lies within 1 SD of the mean. Approximately 95 % of the data lies within 2 SD of the mean. Approximately 99.7 % of the data lies within 3 SD of the mean.
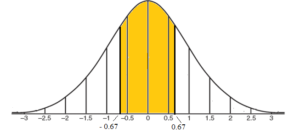
The Z – score:
The number of standard deviations from the mean is called the standard score or z – score.
An arbitrary normal distribution can be converted to a standard normal distribution by changing variables to z.

Empirical Rules for z – Scores:
- Approximately 68 % of the data lies within 1 SD of the mean.
- Approximately 95 % of the data lies within 2 SD of the mean.
- Approximately 99.7 % of the data lies within 3 SD of the mean.
Importance of z – Score:
Z-Scores tell us whether a particular score is equal to the mean, below the mean or above the mean of a bunch of scores. They can also tell us how far a particular score is away from the mean.
| Z-Score | Conclusion |
| 0 | It is equal to the group mean |
| Positive | It is above the group mean |
| Negative | It is below the group mean |
| + 1 | It is 1 Standard Deviation above the mean |
| + 2 | It is 2 Standard Deviation above the mean |
| – 1 | It is 1 Standard Deviation below the mean |
| – 2 | It is 1 Standard Deviation below the mean |
We can use Z-scores to standardize scores from different groups of data. Then we can compare raw scores from different groups of data.
Example – 01:
95 % of students at the college are between 1.1 m and 1.7 m tall. Find mean and the standard deviation assuming a normal distribution.
Solution:
Mean = μ = average of the two values given = (1.1 + 1.7)/2 = 2.8/2 = 1.4 m
From empirical rule states that approximately 95 % of the data lies within 2 SD of the mean on either side.
Therefore the total deviation is 4 S.D.
4 S.D. = 1.7 – 1.1
4 S.D. = 0.6
1 S.D. = σ = 0.15 m
Ans: Mean = 1.4 m and the standard deviation is 0.15 m
Example – 02:
95 % of students in a class of 100 weigh between 62 kg and 90 kg. Find mean and standard deviation assuming a normal distribution.
Solution:
Mean = μ = average of the two values given = (62 + 90)/2 = 152/2 = 76 kg
From empirical rule states that approximately 95 % of the data lies within 2 SD of the mean on either side.
Therefore the total deviation is 4 S.D.
4 S.D. = 90 – 62
4 S.D. = 28
1 S.D. = σ = 7 kg
Ans: Mean = 76 kg and standard deviation is 7 kg
Example – 03:
68 % of marks of students in a certain test are between 51 and 64. Find mean and standard deviation assuming a normal distribution.
Solution:
Mean = μ = average of the two values given = (51 + 64)/2 = 115/2 = 57.5 kg
From empirical rule states that approximately 68 % of the data lies within 1 SD of the mean on either side.
Therefore the total deviation is 2 S.D.
2 S.D. = 64 – 51
2 S.D. = 13
1 S.D. = σ = 6.5 kg
Ans: Mean marks = 57.5 and standard deviation in marks is 6.5
Example – 04:
99.7 % of electrical components produced by a machine have lengths between 1.176 cm and 1.224 cm. Find mean and standard deviation assuming a normal distribution.
Solution:
Mean = μ = average of the two values given = (1.176 + 1.224)/2 = 2.4/2 = 1. 2 cm
From empirical rule states that approximately 99.7 % of the data lies within 3 SD of the mean on either side.
Therefore the total deviation is 6 S.D.
6 S.D. = 1.224 – 1.176
6 S.D. = 0.048
1 S.D. = σ = 0.008 cm
Ans: Mean length = 1.2 cm and standard deviation in length is 0.008 cm
2 replies on “Probability: Normal Distribution”
There was an error on example 4: SD = 0.008 (instead of 0.08).
Thank you Jairo. Correction done