Science > Mathematics > Statistics and Probability > Probability > Normal Distribution 02
In this article, we shall study to find the probability of an event when data normally distributed is given.
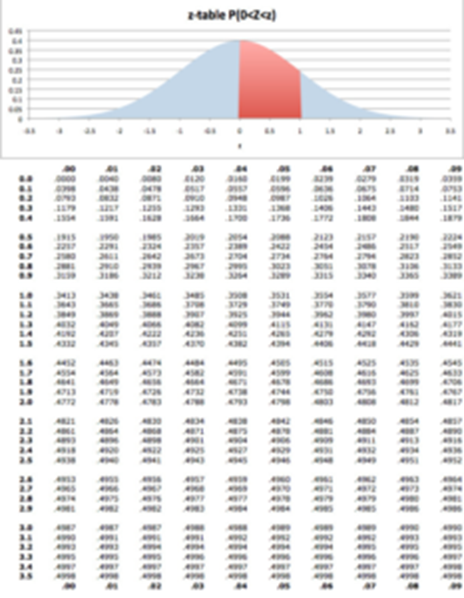
Area Under Normal Curve (0 < x< z)
Example – 01:
A sample of 100 dry battery cells tested to find the length of life produced the following results. Mean = μ = 12 hours, standard deviation = σ = 3 hours. Assuming that the data are normally distributed, what percentage of battery cells are expressed to have the life a) more than 15 hours, b) less than 6 hours, and c) between 10 hours and 14 hours. Given:
| z | 2.5 | 2 | 1 | 0.67 |
| Area | 0.4938 | 0.4772 | 0.3413 | 0.2486 |
Solution:
We have Mean = μ = 12 hours, standard deviation = σ = 3 hours, Total number of objects = N = 100
P(life of battery more than 15 hours)
The standardized value of x = 15 is z = (x – μ)/σ
= (15 – 12)/3 = 3/3 = 1
P(z >1) = area under the standard normal curve to the right of z = 1
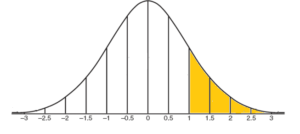
P(z >1) = (Area to the right of z = 0) – (Area between z = 0 and z = 1)
P(z >1) = 0.5 – 0.3413 = 0.1587
P(life of battery less than 6 hours)
The standardized value of x = 6 is z = (x – μ)/σ
= (6 – 12)/3 = – 6/3 = – 2
P(z < – 2) = area under the standard normal curve to the left of z = -2

P(z < -2) = (Area to the left of z = 0) – (Area between z = 0 and z = -2)
P(z >1) = 0.5 – 0.4772 = 0.0228
P(life of battery between 10 hours and 14 hours)
The standardized value of x = 10 is z = (x – μ)/σ
= (10 – 12)/3 = – 2/3 = – 0.67
The standardized value of x = 14is z = (x – μ)/σ
= (14 – 12)/3 = 2/3 = 0.67
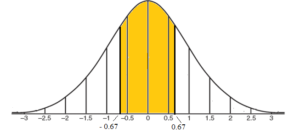
P(- 0.67 < z < 0.67) = area under the standard normal curve between
z = 0.67 and z = – 0.67
P(- 0.67 < z < 0.67) = (Area between z = 0 and z = – 0.67) + (Area between z = 0 and z = 0.67)
P(- 0.67 < z < 0.67) = 2 x (Area between z = 0 and z = – 0.67)
= 2 x 0.2486 = 0.4972
Ans: 15.87% batteries have life more than 15 hours.
2.28% batteries have life less than 6 hours.
49.72% batteries have life between 10 hours and 14 hours.
Example – 02:
In a certain examination, 500 students appeared. Means score is 68 and SD 8. Assuming that the data are normally distributed find the number of students scoring a) less than 50 and b) more than 60.
Solution:
We have Mean = μ = 68, standard deviation = σ = 8, Total number of students = N = 500
P(marks less than 50)
The standardized value of x = 50 is z = (x – μ)/σ
= (50 – 68)/8 = – 18/8 = – 2.25
P(z < – 2.25) = area under the standard normal curve to the left of z = – 2.25
P(z < – 2.25) = (Area to the right of z = 0) – (Area between z = 0 and z = -2.25)
P(z < – 2.5) = 0.5 – 0.4878 = 0.0122
Number of students got less than 50 marks = N x P(z < – 2.25)
= 500 x 0.0122 = 6 (Appox.)
P(marks more than 60)
The standardized value of x = 50 is z = (x – μ)/σ
= (60 – 68)/8 = – 8/8 = – 1
P(z > – 1) = area under the standard normal curve to the right of z = – 1
P(z > – 1) = (Area to the right of z = 0) + (Area between z = 0 and z = -1)
P(z > – 1) = 0.5 + 0.3413 = 0.8413
Number of students got more than 60 marks = N x P(z > – 1)
= 500 x 0.8413 = 421 (Appox.)
Ans: Number of students got less than 50 marks are 6
Number of students got more than 60 marks are 421
Example – 03:
Sacks of sugar-packed by an automatic loader having an average weight of 100 kg and with a standard deviation of 0.250 kg. Assuming that the data are normally distributed, find the chance of sack weighing less than 99.5 kg.
Solution:
We have Mean = μ = 100 kg, standard deviation = σ = 0.250 kg
P(weight less than 99.5 kg)
The standardized value of x = 99.5 is z = (x – μ)/σ
= (99.5 – 100)/0.250 = – 0.5/0.250 = – 2
P(z < – 2) = area under the standard normal curve to the left of z = – 2
P(z < – 2) = (Area to the right of z = 0) – (Area between z = 0 and z = -2)
P(z < – 2) = 0.5 – 0.4772 = 0.0228
Ans: The chance of sack weighing less than 99.5 kg is 0.0228 or 2.28%
Example – 04:
In a test 0f 2000 electric bulbs, it was found that the life of a particular make was normally distributed with an average life of 2040 hours and a standard deviation of 60 hours. Estimate the number of bulbs likely to burn for a) between 1920 hours and 2160 hours and b) more than 2150 hours. Given A(2) = 0.4772, A(1.83) = 0.4664
Solution:
We have Mean = μ = 2040 hours, standard deviation = σ = 60 hours, Total number of bulbs = N = 2000
P(Working life between 1920 hours and 2160 hours)
The standardized value of x = 1920 is z = (x – μ)/σ
= (1920 – 2040)/60 = – 120/60 = – 2
The standardized value of x = 2160 is z = (x – μ)/σ
= (2160 – 2040)/60 = 120/60 = 2
P(- 2 < z < 2) = area under the standard normal curve between z = -2 and z = 2
P(- 2 < z < 2) = (Area between z = 0 and z = -2) + (Area between z = 0 and z = 2)
P(- 2 < z < 2) = 2 x (Area between z = 0 and z = 2) = 2 x 0.4772 = 0.9544
Number of bulbs having life between 1920 hours and 2160 hours
= N x P(- 2 < z < 2)
= 2000 x 0.9544 =1909 (Appox.)
P(Working life morethan 2150 hours)
The standardized value of x = 2150 is z = (x – μ)/σ
= (2150 – 2040)/60= 110/60 = 1.83
P(z > 1.83) = area under the standard normal curve to the right of z = 1.83
P(z > 1.83) = (Area to the right of z = 0) – (Area between z = 0 and z = 1.83)
P(z > 1.83) = 0.5 – 0.4664 = 0.0336
Number of bulbs having life more than 2150 hours
= N x P(z > 1.83)
= 2000 x 0. 0336 = 67 (Appox.)
Ans: The number of bulbs having life between 1920 hours and 2160 hours is 1909 and the number of bulbs having life more than 2150 hours is 67
Example – 05:
In a test of 2000 electric bulbs, it was found that the life of a particular make was normally distributed with an average life of 2040 hours and a standard deviation of 60 hours. Estimate the number of bulbs likely to burn for a) between 1920 hours and 2160 hours and b) more than 2150 hours. Given A(2) = 0.4772, A(1.83) = 0.4664
Solution:
We have Mean = μ = 2040 hours, standard deviation = σ = 60 hours, Total number of bulbs = N = 2000
P(Working life between 1920 hours and 2160 hours)
The standardized value of x = 1920 is z = (x – μ)/σ
= (1920 – 2040)/60 = – 120/60 = – 2
The standardized value of x = 2160 is z = (x – μ)/σ
= (2160 – 2040)/60 = 120/60 = 2
P(- 2 < z < 2) = area under the standard normal curve between z = -2 and z = 2
P(- 2 < z < 2) = (Area betweenz = 0 and z = -2) + (Area between z = 0 and z = 2)
P(- 2 < z < 2) = 2 x (Area between z = 0 and z = 2) = 2 x 0.4772 = 0.9544
Number of bulbs having life between 1920 hours and 2160 hours
= N x P(- 2 < z < 2)
= 2000 x 0.9544 =1909 (Appox.)
P(Working life morethan 2150 hours)
The standardized value of x = 2150 is z = (x – μ)/σ
= (2150 – 2040)/60= 110/60 = 1.83
P(z > 1.83) = area under the standard normal curve to the right of z = 1.83
P(z > 1.83) = (Area to the right of z = 0) – (Area between z = 0 and z = 1.83)
P(z > 1.83) = 0.5 – 0.4664 = 0.0336
Number of bulbs having life more than 2150 hours
= N x P(z > 1.83)
= 2000 x 0. 0336 = 67 (Appox.)
Ans: The number of bulbs having life between 1920 hours and 2160 hours is 1909 and the number of bulbs having life more than 2150 hours is 67
Example – 06:
The scores of 1000 students have a mean 14 and standard deviation 2.5. Assuming the data to be normally distributed, find a) how many students secured marks between 12 and 15? and b) How many student score more than 18. Given A(0.8) 0.2882, A(0.4) 0.1554, A(1.6) = 0.4452.
Solution:
We have Mean = μ = 14, standard deviation = σ = 2.5, Total number of students = N = 1000
P(score between 12 and 15)
The standardized value of x = 12 is z = (x – μ)/σ
= (12 – 14)/2.5 = – 2/2.5 = – 0.8
The standardized value of x = 15 is z = (x – μ)/σ
= (15 – 14)/2.5 = 1/2.5 = 0.4
P(- 0.8 < z < 0.4) = area under the standard normal curve between z = – 0.8 and z = 0.4
P(- 0.8 < z < 0.4) = (Area betweenz = 0 and z = – 0.8) + (Area between z = 0 and z = 0.4)
P(- 0.8 < z < 0.4) = 0.2881 + 0.1554 = 0.4435
Number of students who score between 12 and 14
= N x P(- 0.8 < z < 0.4)
= 1000 x 0.4435 = 444 (Appox.)
P(Score more than 18)
The standardized value of x = 18 is z = (x – μ)/σ
= (18 – 14)/2.5= 4/2.5 = 1.6
P(z > 1.6) = area under the standard normal curve to the right of z = 1.6
P(z > 1.6) = (Area to the right of z = 0) – (Area between z = 0 and z = 1.6)
P(z > 1.6) = 0.5 – 0.4452 = 0.0548
Number of students who score more than 18
= N x P(z > 1.6)
= 1000 x 0. 0548 = 55 (Appox.)
Ans: The number of students who score between 12 and 14 is 444 and the number of students who score more than 18 is 55