Science > Chemistry > Chemical Equilibrium > Gibb’s Energy and Chemical Equilibrium
Gibb’s Energy or Free Energy:
Gibb’s energy or free energy is a thermodynamic function which helps us in the development of a criterion of spontaneity or feasibility of a process. It refers to the capacity of the system to do useful work.
Gibb’s energy is defined as the amount of energy available from a system at a given set of conditions that can be put into useful work. It is also called free energy.
Mathematically, G = U + PV – TS
Where G = Gibb’s energy
U = Internal energy of the system
P = Pressure of the system
V = Volume of the system
T = Absolute temperature of the system
S = Entropy of the system
The absolute value of Gibb’s energy cannot be calculated. But the change in it can be calculated as
ΔG = ΔU + Δ(PV) – Δ(TS)
For constant pressure and constant temperature process
ΔG = ΔU + PΔV – TΔS
But ΔU + PΔV = ΔH
∴ ΔG = ΔH – TΔS
This relation is known as Gibb’s Helmholtz equation.
Where, ΔG = Change in Gibb’s energy
ΔH = Change in enthalpy of the system
T = Absolute temperature of the system
ΔS = Change in entropy of the system
The spontaneity of a Reaction w.r.t. Gibb’s Energy and Total Entropy:
Let ΔSTotal be the total enthalpy of the system and ΔGT,P is Gibb’s energy at constant temperature and pressure.
- If ΔSTotal > 0 (positive) or ΔGT,P < 0 (negative), the process will be spontaneous and proceeds in a backward direction. It nears to completion. (K > 1)
- If ΔSTotal < 0 (negative) or ΔGT,P > 0 (positive), the process will be non-spontaneous. and favoured in backward direction. (K < 1)
- If ΔSTotal = 0 or ΔGT,P = 0, the process will be in equilibrium state. (K = 1)
Relation Between Gibb’s Energy and Chemical Equilibrium:
For spontaneous process Gibb’s energy is negative. For a reversible reaction, there is a decrease in Gibb’s energy during the course of reaction whether we start from reactants or products. Let us consider a hypothetical reaction
A ⇌ B
A graph is drawn by taking Gibb’s energy on the y-axis and the change in the composition of the reacting mixture with time on the x-axis. The graph is as follows.
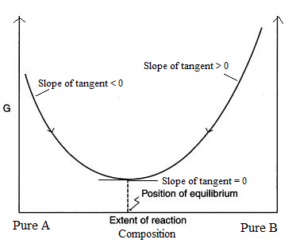
The minima in the curve correspond to the composition of the reaction mixture at the equilibrium state at which Gibb’s energy is minimum.
From graph following points should be noted.
- In reaching the equilibrium state whether from A or from B, the ΔG is negative.
- At equilibrium state, there is no change in Gibb’s energy. i.e. ΔG at equilibrium = 0.
- If minima of the curve lie very close to the products, then it means that the equilibrium composition strongly favours the products and hence K >> 1. i.e. reaction will proceed to completion.
- If minima of the curve lie very close to the reactants, then it means that the equilibrium composition strongly favours the reactants and hence K < 1. i.e. the reaction hardly proceeds.
Relation Between Standard Gibb’s Energy change and Equilibrium Constant:
Let us consider a hypothetical reaction
A + B ⇌ C + D
The relation between Gibb’s energy change (ΔG)and standard Gibb’s energy change ΔGo is given by
ΔG = ΔGo + RT ln Q
Where R = Universal gas constant
T = Absolute temperature of the system
Q = Concentration coefficient
At equilibrium ΔG = 0 and Q = Kc
∴ 0 = ΔGo + RT ln Kc
∴ ΔGo = – RT ln Kc
∴ ΔGo = – 2.303 RT log 10 Kc
This is the relation between the standard Gibb’s energy change and equilibrium constant. In exponential form, the expression can be written as
